

Test your understanding of Python Data Structure, which we learned in our previous lesson of Day 13 of Learning Python for Data Science, with these targeted practice questions.
Welcome back to Day 13 of Learning Python for Data Science journey! In the last article, we explored:
✅ Pivot
✅ Apply
✅ Regular Expressions
Now, it’s time to solve the practice questions given in the previous article.
Each question is followed by a detailed explanation and output.
Find the phone number. text = “My phone number is a 9876543210 986 047.”
text = "My phone number is a 9876543210 9876543210 986 047."

result = re.search(r'\d{10}', text)
result.group() # Returns first occurance of the match.

result1 = re.findall(r'\d{10}', text)
result1 # Returns all occurance of the match.
Output:
['9876543210', '9876543210']
Identify valid email addresses from a list.
emails = [“johnsmith@example.com”,”john.smith@example.com”,”john123@example.com”,”john_smith-jr@example.com”,”user@mail.hr.example.com”,”alice@example.co.uk”,”user@123domain.com”,”user@data.science.org”,”first.last+alias@example.com”,”\”user@strange\”@example.com”, “John.Smith@Example.COM”, “name@e-mail-server.com”]
[i for i in emails if re.search(r'[\w\._-]+@[\w_-]+\.\w+',i)]Output:
['johnsmith@example.com', 'john.smith@example.com', 'john123@example.com', 'john_smith-jr@example.com', 'user@mail.hr.example.com', 'alice@example.co.uk', 'user@123domain.com', 'user@data.science.org', 'first.last+alias@example.com', 'John.Smith@Example.COM', 'name@e-mail-server.com']
Extract all hashtags from a sentence. text = “I love #Python and #MachineLearning!”
re.findall(r'#\w+', text)Output:
['#Python', '#MachineLearning']
Replace all dates in the format YYYY-MM-DD with [DATE]. text = “The meeting is on 2024-12-22.”
re.sub(r'\d+-\d+-\d+', "[DATE]", text)Output:
'The meeting is on [DATE].'
Extract phone numbers from a string. text = “Call me at 9876543210 or at 1234567890.”
re.findall(r'\d{10}', text)Output:
['9876543210', '1234567890']
Use re.search() to extract the first number from a sentence.
text = "I walked 5 kilometers today and burned 300 calories."

re.search(r'\d', text).group()
Output:
'5'
Use re.match() to check if a string starts with a capital letter.
text = "I walked 5 kilometers today and burned 300 calories."

re.match(r'[A-Z]', text).group() # re.match() returns an object .group() is used to extract the result.
Output:
'I'
Use re.findall() to extract all email addresses from a paragraph.
paragraph = “””
Please reach out to our team at support@example.com or marketing.team@business.co.uk.
For press inquiries, contact media@news.org. You can also connect with john_doe123@company.net.
“””
re.findall(r'[\w.+_]+@[\w.+_].[\w.+_]+', paragraph)Output:
['support@example.com', 'marketing.team@business.co.uk.', 'media@news.org.', 'john_doe123@company.net.']
Extract all phone numbers of pattern xxx-xxx-xxxx from text using re.findall().
text = "You can reach us at 123-456-7890 or 987-654-3210. Emergency contact: 555-000-1111. Invalid: 12-3456-7890 or 1234567890."

re.findall(r'\d{3}-\d{3}-\d{4}', text)
Output:
['123-456-7890', '987-654-3210', '555-000-1111']
Replace all digits in a string with # using re.sub().
text = "You can reach us at 123-456-7890 or 987-654-3210."

re.sub(r'\d', '#', text)
Output:
'You can reach us at ###-###-#### or ###-###-####.'
Extract all hashtags from a tweet using regex.
tweet = "Loving the vibes at the beach! 🌊 #sunset #vacation #RelaxMode"

re.findall(r'#\w+', tweet)
Output:
['#sunset', '#vacation', '#RelaxMode']
Validate if a given string is a valid date in format YYYY-MM-DD.
text = "The project began on 2023-05-12 and saw major updates on 2023-11-28 and 2024-02-30."

re.findall(r'\d{4}-\d{2}-\d{2}', text)
Output:
['2023-05-12', '2023-11-28', '2024-02-30']
Extract all words that start with capital letters and are more than 5 characters long.
text = "Alexander traveled to California for the International Conference on Data Science. While there, he met Benjamin and participated in Workshops and Seminars hosted by Google and Microsoft."

re.findall(r'\b[A-Z][a-zA-Z]{5,}\b', text)
Output:
['Alexander', 'California', 'International', 'Conference', 'Science', 'Benjamin', 'Workshops', 'Seminars', 'Google', Microsoft']
Remove all special characters except alphabets and numbers from a text string.
text = "Hello is this for > $12"

re.sub(r'[^A-Za-z0-9]', '', text)
Output:
Helloisthisfor12
Use regex to split a sentence into words ignoring punctuation.
sentence = "Hello, world! How's everything going?"

re.findall(r'\b\w+\b', sentence)
Output:
['Hello', 'world', 'How', 's', 'everything', 'going']
Create a DataFrame with sales data and pivot it.
data = {
    "Date": ["2024-04-01", "2024-04-01", "2024-04-02", "2024-04-02", "2024-04-03"],
    "Product": ["Laptop", "Phone", "Tablet", "Laptop", "Phone"],
    "Units Sold": [5, 10, 3, 2, 7],
    "Unit Price": [1000, 500, 300, 1000, 500],
    "Region": ["North", "South", "East", "West", "North"]
}

# Create DataFrame
df = pd.DataFrame(data)

df['Total Sales'] = df['Unit Price']*df['Units Sold']

df.pivot(index = 'Region', columns = 'Product', values= 'Total Sales').fillna(0)
Output:
Product	Laptop	Phone	Tablet
Region
East	        0.0	        0.0	        900.0
North	5000.0	3500.0	0.0
South	0.0	        5000.0	0.0
West	2000.0	0.0	        0.0
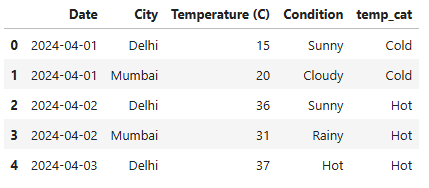
Write a function to categorize temperatures (Cold, Warm, Hot) and apply it to a DataFrame.
data = {
    "Date": ["2024-04-01", "2024-04-01", "2024-04-02", "2024-04-02", "2024-04-03"],
    "City": ["Delhi", "Mumbai", "Delhi", "Mumbai", "Delhi"],
    "Temperature (C)": [15, 20, 36, 31, 37],
    "Condition": ["Sunny", "Cloudy", "Sunny", "Rainy", "Hot"]
}

# Create DataFrame
df = pd.DataFrame(data)

df['temp_cat'] = df['Temperature (C)'].apply(lambda x : 'Hot' if x > 20 else ('Warm' if x > 15 and x < 20 else 'Cold'))
Output:
Calculate total pay for employees given hours worked and hourly rate.
df["Total Pay"] = df["Hours Worked"] * df["Hourly Rate"]Output:
  Employee  Hours Worked  Hourly Rate  Total Pay
0    Alice             40           20        800
1      Bob             35           22        770
2  Charlie             45           18        810
3    Diana             30           25        750
4    Ethan             50           15        750
Create a pivot table showing the average salary by department.
pivot_table = df.pivot_table(index='Department', values='Salary', aggfunc='mean')Output:
            Salary
Department
Finance     62500.0
HR          51000.0
IT          71000.0
Count the number of employees in each city using a pivot table.
pivot_table = df.pivot_table(index='City', values='Employee', aggfunc='count')Output:
             Employee
City
Chicago             2
Los Angeles         2
New York            2
Create a pivot table showing total sales by product.
pivot_table = df.pivot_table(index='Product', values='Total Sales', aggfunc='sum')Output:
         Total Sales
Product
Laptop         7000
Phone          8500
Tablet         2100
Create a pivot table showing the average age by gender and department.
pivot_table = df.pivot_table(index=['Gender', 'Department'], values='Age', aggfunc='mean')Output:
                                      Age
Gender Department
Female Finance             30.0
       HR                          26.5
       IT                            22.0
Male   Finance               30.0
       HR                          28.0
       IT                           35.0
Create a pivot table with multiple aggregation functions (mean and sum) for sales by region.
pivot_table = df.pivot_table(
    index='Region',
    values='Total Sales',
    aggfunc={'Total Sales': ['sum', 'mean']}
)
Output:
                        Total Sales
                        sum     mean
Region
East               2100    700.0000
North           10500   3500.0000
South           6500    3250.0000
West            5600    2800.0000
Create a pivot table showing percentage contribution of each product in overall sales.
# Pivot table: Total sales by product
pivot_table = df.pivot_table(
    index='Product',
    values='Total Sales',
    aggfunc='sum'
)

# Calculate overall total sales
overall_sales = pivot_table['Total Sales'].sum()

pivot_table['Percentage Contribution'] = (pivot_table['Total Sales'] / overall_sales) * 100
Output:
                    Total Sales  Percentage Contribution
Product
Laptop         15000                50.000000
Phone          10500                35.000000
Tablet           3000                  15.000000
Create a pivot table with custom aggregation (e.g., standard deviation of scores by subject).
pivot_std = pd.pivot_table(
    df,
    index='Subject',
    values='Score',
    aggfunc=np.std
)
Output:
               Score
Subject
English  2.516611
Math     3.511885
Science  2.054805
Use margins in a pivot table to include row and column totals.
# Pivot table with margins
pivot_table = pd.pivot_table(
    df,
    index='Region',
    columns='Product',
    values='Sales',
    aggfunc='sum',
    margins=True,
    margins_name='Total'  # Custom name for totals
)
Output:
Product   Laptop  Phone  Tablet  Total
Region
East        1300    500     NaN   1800
North       1000   1500     NaN   2500
South       1200    NaN     800   2000
West         NaN    600     700   1300
Total       3500   2600    1500   7600
margins=True: Adds row and column totals.

margins_name='Total': Customizes the label used for totals (default is "All").

Missing values are shown as NaN where no data is available.
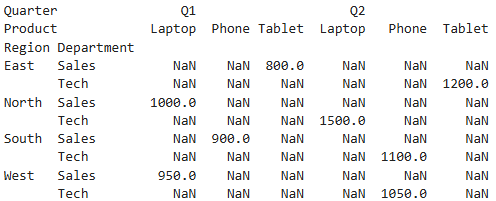
Create a pivot table with a hierarchical index (multi-level rows and columns).
pivot_table = pd.pivot_table(
    df,
    index=['Region', 'Department'],
    columns=['Quarter', 'Product'],
    values='Revenue',
    aggfunc='sum'
)
Output:
Filter a pivot table to show only values where the average sales exceed a threshold.
pivot = pd.pivot_table(
    df,
    index='Region',
    columns='Product',
    values='Sales',
    aggfunc='mean'
)


filtered = pivot.where(pivot > 1000)
Output:
Product  Laptop   Phone  Tablet
Region
East       NaN     NaN   1100.0
North    1200.0    NaN     NaN
South    1300.0    NaN     NaN
West     1250.0    NaN     NaN
Use .apply() to calculate the length of strings in a Name column.
# Sample data with a 'Name' column
data = {
    'Name': ['Alice', 'Bob', 'Charlie', 'David'],
    'Age': [25, 30, 35, 40]
}

# Create DataFrame
df = pd.DataFrame(data)

# Calculate the length of strings in the 'Name' column using apply()
df['Name Length'] = df['Name'].apply(len)

print(df)
Output:
         Name       Age  Name Length
0         Alice         25            5
1         Bob          30            3
2         Charlie     35            7
3         David       40            5
Use .apply() to convert a list of dates from string to datetime.
df['Date'] = df['Date'].apply(pd.to_datetime)Output:
        Date
0 2024-04-01
1 2024-05-01
2 2024-06-01
3 2024-07-01
Apply a function to standardize a column (z-score).
# Define function to calculate Z-score
def z_score(x, mean, std):
    return (x - mean) / std

# Calculate the mean and standard deviation
mean = df['Scores'].mean()
std = df['Scores'].std()

# Apply the function to the 'Scores' column to standardize it
df['Z-Score'] = df['Scores'].apply(z_score, args=(mean, std))

print(df)
Output:
   Scores   Z-Score
0      85    -1.264911
1      90    -0.632456
2      95     0.000000
3     100    0.632456
4     105    1.264911
Use row-wise .apply() to calculate total marks from multiple score columns.
# Define a function to calculate the total marks for each row
def total_marks(row):
    return row.sum()

# Apply the function row-wise (axis=1)
df['Total Marks'] = df.apply(total_marks, axis=1)
Output:
   Math  English  Science  Total Marks
0    85       78       90          253
1    90       88       85          263
2    95       92       95          282
3   100      85      100         285
Apply a function that flags customers as “High” or “Low” value based on total purchase.
# Sample sales data
data = {
    'Customer ID': [1, 2, 3, 4, 5],
    'Product': ['Laptop', 'Phone', 'Tablet', 'Laptop', 'Phone'],
    'Quantity': [2, 5, 1, 3, 4],
    'Unit Price': [1000, 500, 300, 1000, 500]
}

# Create DataFrame
df = pd.DataFrame(data)

# Calculate total purchase (Total = Quantity * Unit Price)
df['Total Purchase'] = df['Quantity'] * df['Unit Price']

# Function to flag as 'High' or 'Low' value customer based on total purchase
def flag_customer(row):
    if row['Total Purchase'] > 2000:
        return 'High'
    else:
        return 'Low'

# Apply the function to create a new column 'Customer Value'
df['Customer Value'] = df.apply(flag_customer, axis=1)

print(df)
Output:
   Customer ID     Product     Quantity     Unit Price     Total Purchase    Customer Value
0            1               Laptop         2              1000                 2000                   Low
1            2               Phone          5               500                  2500                   High
2            3               Tablet           1               300                  300                     Low
3            4               Laptop         3              1000                 3000                   High
4            5               Phone          4                500                 2000                   Low
Use .apply() to extract the domain name from an email address column.
# Function to extract domain name from an email address
def extract_domain(email):
    return email.split('@')[1]

# Apply the function to extract domain names
df['Domain'] = df['Email'].apply(extract_domain)
Output:
      Name                Email                  Domain
0     John     john@example.com   example.com
1    Alice    alice@company.org     company.org
2      Bob       bob@domain.net     domain.net
3  Charlie  charlie@webmail.com   webmail.com
Apply a lambda function that returns different values based on multiple conditions (e.g., risk score).
df['Risk Level'] = df['Score'].apply(lambda x: 'High Risk' if x < 50 else ('Medium Risk' if x < 75 else 'Low Risk'))Output:
      Name   Score   Risk Level
0     John      85       Low Risk
1     Alice      42       High Risk
2     Bob       73       Medium Risk
3     Charlie   91      Low Risk
Use .apply() on grouped data to calculate the range of each group.
# Sample data with sales
data = {
    'Product': ['A', 'A', 'A', 'B', 'B', 'C', 'C', 'C'],
    'Sales': [250, 300, 350, 400, 450, 100, 150, 200]
}

# Create DataFrame
df = pd.DataFrame(data)

# Group by 'Product' and apply a lambda function to calculate the range (max - min)
range_df = df.groupby('Product')['Sales'].apply(lambda x: x.max() - x.min()).reset_index()

# Rename the column for clarity
range_df.columns = ['Product', 'Sales Range']

print(range_df)
Output:
  Product  Sales Range
0       A          100
1       B           50
2       C          100
Create a new column that computes weighted average of other columns using .apply().
# Sample data with scores and their corresponding weights
data = {
    'Subject1_Score': [90, 85, 88, 92],
    'Subject2_Score': [80, 75, 78, 85],
    'Subject1_Weight': [0.6, 0.7, 0.5, 0.4],
    'Subject2_Weight': [0.4, 0.3, 0.5, 0.6]
}

# Create DataFrame
df = pd.DataFrame(data)

# Define a function to calculate the weighted average for each row
def weighted_average(row):
    total_score = (row['Subject1_Score'] * row['Subject1_Weight']) + (row['Subject2_Score'] * row['Subject2_Weight'])
    total_weight = row['Subject1_Weight'] + row['Subject2_Weight']
    return total_score / total_weight

# Apply the weighted_average function to each row
df['Weighted_Avg'] = df.apply(weighted_average, axis=1)

# Display the DataFrame with the new column
print(df)
Output:
   Subject1_Score  Subject2_Score  Subject1_Weight  Subject2_Weight  Weighted_Avg
0               90                    80                    0.6                       0.4                       85.000000
1               85                    75                    0.7                       0.3                       81.000000
2               88                    78                    0.5                       0.5                       83.000000
3               92                    85                    0.4                       0.6                       88.000000
Combine .apply() with np.where or nested if-else logic for complex row-wise classification.
# Sample data with age and income columns
data = {
    'Age': [25, 35, 29, 40, 22],
    'Income': [35000, 50000, 29000, 60000, 25000]
}

# Create DataFrame
df = pd.DataFrame(data)

# Use np.where() for classification
df['Risk'] = np.where((df['Age'] < 30) & (df['Income'] < 40000), 'High Risk',
                  np.where((df['Age'] >= 30) & (df['Income'] >= 40000), 'Low Risk', 'Medium Risk'))

print(df)
Output:
   Age  Income         Risk
0   25   35000    High Risk
1   35   50000     Low Risk
2   29   29000    High Risk
3   40   60000     Low Risk
4   22   25000    High Risk
We hope this article was helpful for you and you learned a lot about data science from it. If you have friends or family members who would find it helpful, please share it to them or on social media.
Join our social media for more.
Python for Data Science Python for Data Science Python for Data Science Python for Data Science Python for Data Science Python for Data Science Python for Data Science Python for Data Science Python for Data Science Python for Data Science Python for Data Science Python for Data Science Python for Data Science Python for Data Science Python for Data Science Python for Data Science Python for Data Science Python for Data Science
Also Read:
- Mastering Pivot Table in Python: A Comprehensive Guide
- Data Science Interview Questions Section 3: SQL, Data Warehousing, and General Analytics Concepts
- Data Science Interview Questions Section 2: 25 Questions Designed To Deepen Your Understanding
- Data Science Questions Section 1: Data Visualization & BI Tools (Power BI, Tableau, etc.)
- Optum Interview Questions: 30 Multiple Choice Questions (MCQs) with Answers
Hi, I am Vishal Jaiswal, I have about a decade of experience of working in MNCs like Genpact, Savista, Ingenious. Currently i am working in EXL as a senior quality analyst. Using my writing skills i want to share the experience i have gained and help as many as i can.