

Z-Test: Overview and Requirements
- Purpose:
- Used to compare the mean of one sample to a known value (one-sample Z-test).
- Used to compare the means of two independent groups (two-sample Z-test).
Requirements for Z-Test:
- Sample Size: Ideally, a minimum sample size (n) of 30 or more is recommended. This ensures the Central Limit Theory applies, making the normality assumption (important for Z-tests) more reliable.
- Independence (for Two Groups): When comparing two groups, the samples must be independent. This means the selection of one data point from one group doesn’t influence the selection of another data point from the other group. Random sampling techniques are crucial for this.
- Population Standard Deviation: The Z-test assumes that the population standard deviation (σ) is known. If the population standard deviation is unknown and the sample size is small, a T-test might be more appropriate.
- Normality of Data: The Z-test assumes the underlying data follows a normal distribution. For large sample sizes, the Central Limit Theorem ensures the sample mean is approximately normally distributed regardless of the data’s original distribution.
Steps for Conducting a Z-Test
- Gather Your Data:
- Ensure your data meets the requirements (ideally n ≥ 30 and independent samples for two-group comparisons).
- Formulate Hypotheses:
- Null Hypothesis (H₀): States there is no effect or difference (e.g., H₀: μ₁ = μ₂).
- Alternative Hypothesis (H₁): States there is an effect or difference (e.g., H₁: μ₁ ≠ μ₂ for two-tailed, H₁: μ₁ > μ₂ or H₁: μ₁ < μ₂ for one-tailed).
- Calculate the Test Statistic (Z-score):
- Use the appropriate formula based on your scenario:
- One-Sample Z-Test:
- Two-Sample Z-Test:
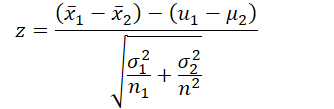
- Here, X̄1 X̄2 is the sample mean, μ1 μ2 is the population mean, σ1 σ2 is the population standard deviation, and n1 n2 is the sample size.
- Choose Significance Level (α):
- Common choices are 0.05 (5%) or 0.01 (1%).
- Determine the Critical Value (Z)*:
- Use a standard normal distribution table or statistical software to find the critical value based on your chosen α.
- For a two-tailed test with α = 0.05, the critical values are approximately ±1.96.
- For a one-tailed test with α = 0.05, the critical value is approximately 1.645 or -1.645 depending on the direction.
- Use a standard normal distribution table or statistical software to find the critical value based on your chosen α.
- Make the Decision:
- Compare the calculated Z-score to the critical value (Z*).
- For a two-tailed test, reject H₀ if ∣𝑍∣>𝑍∗.
- For a one-tailed test, reject H₀ if 𝑍>𝑍∗ (for right-tailed) or 𝑍<−𝑍∗ (for left-tailed).
- If the Z-score falls within the critical region, reject the null hypothesis. Otherwise, fail to reject the null hypothesis.
- |Z|: The absolute value of the calculated Z-score. This means you are considering the distance from zero, regardless of direction.
- Z* (critical value): The threshold value beyond which you reject the null hypothesis.
- Compare the calculated Z-score to the critical value (Z*).
- One-Sample Z-Test:
- Use the appropriate formula based on your scenario:
Example Calculation: One-Sample Z-Test
Scenario: A teacher believes the average score on a history exam is 75 points. We randomly select a sample of 30 students and find their scores. We want to test if the average score from this sample is significantly different from the teacher’s belief.
Data:
- Sample size (n) = 30
- Sample mean (x̄) = 78 points
- Population mean (μ) = 75 points (as per the teacher’s belief)
- Population standard deviation (σ) = 5 points (assumed known)
Steps:
- Formulate Hypotheses:
- Null Hypothesis (H₀): The average score is 75 points (μ = 75).
- Alternative Hypothesis (H₁): The average score is different from 75 points (μ ≠ 75).
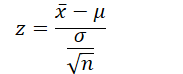
- Calculate the Test Statistic (Z-score):
- Use the formula for a one-sample Z-test:
- Substitute the values:
- Choose Significance Level (α):
- Let’s use α = 0.05 (5%) as a common significance level.
- Determine the Critical Value (Z):*
- Using a standard normal distribution table, the critical value for a two-tailed test with α = 0.05 is approximately ±1.96.
- Make the Decision:
- The calculated Z-score (3.26) is greater than the absolute value of the critical value (1.96).
- Therefore, we reject the null hypothesis (H₀).
Conclusion: Based on the sample data and the Z-test, there is enough evidence to conclude that the average score on the history exam is significantly different from 75 points, as the teacher believed. The actual average score from the sample (78 points) suggests that the students performed slightly better than expected.
We hope you found the information helpful! If you learned something valuable, consider sharing it with your friends, family, and social networks.
Also Read:
- Mann-Whitney U Test Explained
- Chi-Square Test Explained
- ANOVA Analysis of Variance Explained
- T-Test Explained
- Z-Test Explained
- Wilcoxon Signed-Rank Test Explained
Hi, I am Vishal Jaiswal, I have about a decade of experience of working in MNCs like Genpact, Savista, Ingenious. Currently i am working in EXL as a senior quality analyst. Using my writing skills i want to share the experience i have gained and help as many as i can.