
These questions were asked in a recent interview Flipkart Business Analyst, these uncovered questions are extremely important if you are applying for the same position.

Flipkart Business Analyst Interview Questions
SQL Questions:
1. What are window functions, and how do they differ from aggregate functions? Can you give a use case?
Windows functions and aggregate functions both perform calculations across multiple rows, but they differ in how they present the results.
- Aggregate function collapses multiple rows into a single result, but window functions perform calculations across rows without collapsing them, retaining the individual row-level details.
- Aggregate functions use
GROUP BYto group data, and Window functions use Over()with optionalPARTITION BY andORDER BYclauses. - Aggregate functions summarize detassels and window functions allow row-level calculations.
2. Explain indexing. When would an index potentially reduce performance, and how would you approach indexing strategy for a large dataset?
Indexes improve query performance but can also degrade it in high-write scenarios, small tables, and low-cardinality columns. Frequent INSERT/UPDATE/DELETE operations slow down due to index maintenance, while indexing a column with few unique values (e.g., gender) or a small table often provides little to no benefit.
To design an effective indexing strategy, we can use EXPLAIN ANALYZE to identify frequently queried columns. Choosing the right index type is crucial—composite indexes help when filtering on multiple columns, and indexing should focus on columns commonly used in JOIN or WHERE conditions. Regularly reviewing and removing unused indexes ensures optimal performance.
3. Write a query to retrieve customers who have made purchases in the last 30 days but did not purchase anything in the previous 30 days.
WITH Last30Days AS (
    SELECT DISTINCT customer_id
    FROM Orders
    WHERE order_date BETWEEN DATE_SUB(CURDATE(), INTERVAL 30 DAY) AND CURDATE()
)
SELECT l.customer_id
FROM Last30Days l
LEFT JOIN Orders p
ON l.customer_id = p.customer_id
AND p.order_date BETWEEN DATE_SUB(CURDATE(), INTERVAL 60 DAY) AND DATE_SUB(CURDATE(), INTERVAL 31 DAY)
WHERE p.customer_id IS NULL;
https://onecompiler.com/mysql/439gknm8n
We need 2 sets of data to compare:
- Customers who placed an order in the last 30 days.
- Customers who placed an order in between 60 and 31 days ago.
To get the first set we are using a CTE (Last30Days) that retrieves the customer_id from the order table for the last 30 days.
Then, we join this CTE with the orders table on customer_id while checking if the order date falls withing the 60-to-31-day range.
If there is no match (null values in the join result), it means that the customer did not place an order in that previous period. These are the customers we return in the final result.
4. Given a table of transactions, find the top 3 most purchased products for each category.
SELECT * FROM (
    SELECT
        p.category_id,
        t.product_id,
        SUM(t.quantity) AS total_units,
        DENSE_RANK() OVER (PARTITION BY p.category_id ORDER BY SUM(t.quantity) DESC) AS rnk
    FROM transactions t
    INNER JOIN products p USING(product_id)
    GROUP BY p.category_id, t.product_id
) AS ranked_products
WHERE rnk <= 3;
https://onecompiler.com/mysql/439kkdrtx
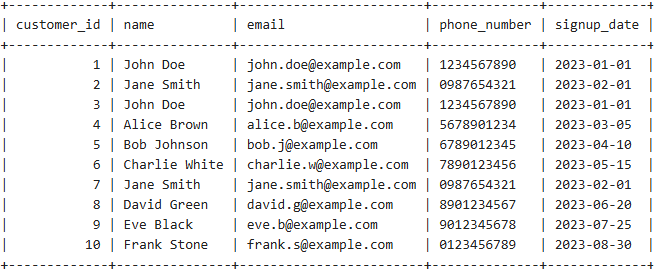
5. How would you identify duplicate records in a large dataset, and how would you remove only the duplicates, retaining the first occurrence?
The better approach in this case would be to first Identify the duplicate records and then deleting them. Lets take an example of Customers table with name, email, phone_number, signup_date.
WITH numbered_row AS (
    SELECT customer_id,
           row_number() OVER (PARTITION BY name, email, phone_number, signup_date ORDER BY customer_id) AS rn
    FROM Customers
)
DELETE FROM Customers
WHERE customer_id IN (
    SELECT customer_id FROM numbered_row WHERE rn > 1
);
https://onecompiler.com/mysql/439ypxzn8
I used ROW_NUMBER() inside a common table expression (CTE) to assign a unique ranking (rn) to each record within groups of potential duplicates, based on matching values for name, email, phone_number and signup_date. The order by customer_id ensures that the records with the smallest customer_id is assigned rn = 1. In the main query, i then deleted all the records where rn > 1, effectively removing duplicates while keeping the first occurrence.
Guesstimates:
1. Estimate the number of online food delivery orders in a large metropolitan city over a month.
I will break this down step by step using population size, adoption rate, and ordering frequency.
- Population & Adoption
- Delhi’s metro population in 2025 is around 35 million.
- Based on smartphone penetration and urban lifestyle, about 35% of people actively use food delivery apps → That’s ~12 million users.
- Order Frequency
- Not everyone orders at the same rate, so we divide users into two groups:
- Frequent users (40%): Order ~6 times a month.
- Casual users (60%): Order ~3 times a month.
- Doing the math:
- Frequent users: 4.8M × 6 orders = ~29M orders
- Casual users: 7.2M × 3 orders = ~22M orders
- Not everyone orders at the same rate, so we divide users into two groups:
- Final Estimate
- Adding both groups, we get ~50 million food delivery orders per month in Delhi.
- Validation
- This aligns with industry data—Delhi contributes ~15-20% of India’s total food delivery market, and platforms like Swiggy & Zomato report similar volumes.
- The market is growing at 23% CAGR, so this estimate fits current trends.
So, based on these factors, I’d estimate Delhi sees around 50 million online food orders per month.
2. How many customer service calls would a telecom company receive daily for a customer base of 1 million?
I will estimate this step by step based on industry benchmarks and customer behavior.
- Understanding the Customer Base
- The telecom company has 1 million customers.
- Not all customers call support daily; we need to determine the call rate.
- Estimating the Call Rate
- Based on industry data, 3% to 5% of customers contact support daily (considering billing issues, network problems, plan changes, etc.).
- Let’s take a midpoint of 4% as a reasonable assumption.
- Final Calculation
- Daily calls = Total customers × Call rate
- 1,000,000 × 4% = 40,000 calls per day
- Validation & Adjustments
- Call volume may spike due to outages, billing cycles, or promotions.
- Automated self-service options (IVR, apps) might reduce calls slightly.
- So, on an average day, the company would likely receive 30,000 to 50,000 calls.
Final Answer: A telecom company with 1 million customers would receive approximately 40,000 customer service calls per day, with variations based on network issues, billing cycles, and customer behavior.
Case Studies:
1. A sudden decrease in conversion rate is observed in a popular product category. How would you investigate the cause and propose solutions?
I would take a structured approach to diagnose the issue and find a solution.
- Identify the Scope of the Problem
- When did the drop in conversion rate start?
- Is it affecting all products in the category or specific ones?
- Is the impact sitewide or limited to certain geographies or customer segments?
- Analyze Data & Identify Trends
- Web Analytics: Check traffic sources, bounce rates, time on page, and cart abandonment rates.
- Funnel Analysis: Identify where drop-offs are happening (product page, add-to-cart, checkout).
- Segmentation: Compare trends across new vs. returning users, device types, and geographies.
- Investigate Potential Causes
- Website or UX Issues: Any recent changes to the website, slow loading pages, broken checkout flow?
- Pricing & Competition: Have competitors reduced prices or launched promotions?
- Product Availability: Are key products out of stock or delayed in delivery?
- Marketing & Traffic Changes: Have ad campaigns changed, leading to lower-quality traffic?
- Customer Feedback: Are reviews indicating quality or pricing concerns?
- Propose Solutions
- Fix UX & Technical Issues: A/B test checkout flow, improve page load speed, fix broken links.
- Optimize Pricing & Offers: Adjust pricing, introduce discounts, or bundle products.
- Improve Inventory & Fulfillment: Ensure stock availability, communicate delivery timelines.
- Refine Marketing Strategy: Retarget lost users, adjust ad spend, refine audience targeting.
- Enhance Customer Trust: Highlight positive reviews, offer guarantees, improve product descriptions.
- Measure & Iterate
- Implement changes in phases and track their impact on conversion rates.
- If the issue persists, conduct deeper qualitative research (user testing, surveys).
Final Answer:
I would first analyze data to identify when and where the drop is happening, investigate causes like UX issues, pricing, stock, or traffic quality, and then test solutions like improving the checkout flow, adjusting marketing, or optimizing pricing. Finally, I’d monitor the impact and iterate based on results.
2. Imagine the company is considering adding a new subscription model. How would you evaluate its potential impact on customer lifetime value and revenue?
To evaluate the potential impact of a new subscription model on customer lifetime value (CLV) and revenue, I would take a structured approach:
- Define the Subscription Model & Key Metrics
- Pricing Structure: Monthly, quarterly, or annual plans? Tiered or flat pricing?
- Target Audience: New customers, existing customers, or both?
- Value Proposition: What benefits does it offer over one-time purchases?
- Estimate Customer Lifetime Value (CLV)
- Baseline CLV: Calculate current CLV based on existing customer spending patterns.
- Projected CLV with Subscription:
- Estimate average revenue per user (ARPU) under the new model.
- Factor in potential increase in retention rate (subscriptions reduce churn).
- Compare expected customer lifespan before and after the subscription model.
- Lower churn = Higher CLV
- Higher ARPU = More predictable revenue
- Assess Revenue Impact
- Short-Term:
- Will subscriptions cannibalize one-time purchases, or increase total spend?
- Initial acquisition cost (CAC) for subscription customers vs. one-time buyers.
- Long-Term:
- Predictable revenue stream (MRR/ARR) stabilizing financial performance.
- Potential for upselling premium tiers or additional services.
- Short-Term:
- Competitive & Market Analysis
- Do competitors have successful subscription models?
- Is there customer demand for recurring purchases?
- Can pricing be optimized for different customer segments?
- Validate Through Testing
- Launch a pilot program with a segment of users.
- Analyze conversion rates, retention, and average spend.
- Gather customer feedback to refine pricing and benefits.
Final Answer:
I would evaluate the subscription model’s impact by analyzing changes in CLV, retention, and ARPU, ensuring it increases long-term revenue. A pilot launch would help validate assumptions before a full rollout, minimizing risk while optimizing pricing and features.
Managerial Questions:
1. Describe a time when you faced conflicting priorities on a project. How did you manage your workload to meet deadlines?
“In my previous role, I was working on an urgent data analysis project while simultaneously handling a last-minute request for a business report from senior leadership. Both had tight deadlines, and failing to deliver either on time would have impacted decision-making.”
How I Managed It:
- Prioritization & Stakeholder Communication
- I immediately assessed the urgency and impact of both tasks.
- I discussed timelines with stakeholders to clarify hard vs. flexible deadlines.
- I negotiated a small extension on the report while ensuring the data analysis stayed on track.
- Time Management & Task Breakdown
- I broke both tasks into manageable chunks and allocated time blocks using the Eisenhower Matrix (urgent vs. important).
- Used productivity techniques like the Pomodoro method to stay focused and avoid burnout.
- Delegation & Automation
- Automated data extraction to save time on analysis.
- Delegated parts of the report to a teammate while focusing on the high-priority sections.
Outcome:
- Successfully delivered both projects on time without compromising quality.
- Strengthened stakeholder relationships by proactively managing expectations.
- Learned the importance of balancing flexibility with strategic prioritization.
Final Takeaway:
“I’ve learned that when faced with conflicting priorities, clear communication, structured time management, and leveraging resources effectively are key to meeting deadlines without sacrificing quality.”
2. How would you handle a disagreement within the team on an analytical approach?
“Disagreements on analytical approaches are common, especially when multiple perspectives exist. I believe the key is to foster collaboration, ensure data-driven decision-making, and align on the business objective.”
How I Would Handle It:
- Understand Each Perspective
- I would encourage team members to explain their approach, underlying assumptions, and expected outcomes.
- Actively listen to understand whether the disagreement stems from data selection, methodology, or interpretation.
- Align on the Business Objective
- Reiterate the core goal of the analysis—whether it’s accuracy, speed, or scalability.
- Ensure that everyone agrees on the success criteria before debating methods.
- Use Data & Experimentation
- Instead of debating in theory, I’d suggest running A/B tests or pilot analyses using both approaches.
- Compare outcomes based on key metrics like accuracy, efficiency, and business impact.
- Facilitate Constructive Discussion
- Maintain a neutral stance and moderate the discussion by highlighting the strengths and limitations of each approach.
- If needed, bring in an external expert or refer to industry best practices for guidance.
- Make a Decision & Move Forward
- If a clear winner emerges from the data, align the team on the decision.
- If both methods have merit, consider hybrid approaches or defer to the one that best meets business needs.
- Ensure that the team remains aligned and focused post-decision to avoid lingering disagreements.
Final Takeaway:
“By fostering a data-driven and collaborative approach, I ensure that disagreements lead to innovation rather than roadblocks. The goal is always to arrive at the best solution, not just prove a point.”
Python Questions:
1. Write a Python function to find the longest consecutive sequence of unique numbers in a list.
def longest_unique_subsequence(nums):
    seen = set()
    longest_seq = []
    current_seq = []
    left = 0  # Left pointer for the sliding window

    for right in range(len(nums)):
        while nums[right] in seen:  # Remove from start until unique
            seen.remove(nums[left])
            current_seq.pop(0)
            left += 1

        seen.add(nums[right])
        current_seq.append(nums[right])

        if len(current_seq) > len(longest_seq):
            longest_seq = current_seq[:]  # Copy the sequence

    return longest_seq
nums = [1, 2, 3, 1, 2, 5]
print(longest_unique_subsequence(nums))
This function uses a sliding window technique where it maintains a left and right pointer and,
- it sees a number from the given input and checks
- if it has not seen this number before
- it adds this number to the seen set and updates right pointer (add the number to current sequence).
- If the number was seen before
- it moves the left pointer forward (removing numbers from the set) until the duplicate is removed.
- Then if the current sequence is longer than longest sequence,
- It updates the longest sequence
- if it has not seen this number before
- This process is repeated until the code reaches to the end of the given list.
2. If you’re working with a large dataset with missing values, what Python libraries would you use to handle missing data, and why?
If i am working with a structured dataset, I would go with Pandas because it is designed for dataframes, Dataframes make it suitable to work with structured dataset.
If i am working with a numerical dataset, NumPy is more efficient
In some cases i might use both converting NumPy arrays into Pandas Dataframes for better flexibility.
Tags: Flipkart Business Analyst, Flipkart Business Analyst, Flipkart Business Analyst, Flipkart Business Analyst, Flipkart Business Analyst,Flipkart Business Analyst, Flipkart Business Analyst, Flipkart Business Analyst, Flipkart Business Analyst,Flipkart Business Analyst,Flipkart Business Analyst,Flipkart Business Analyst,Flipkart Business Analyst,Flipkart Business Analyst,Flipkart Business Analyst,Flipkart Business Analyst,
For More Interview Question Follow Us On:
Thank you for reading! We hope this article has been helpful in Interviews for business analyst roles. If you found it valuable, please share it with your network.
Also Read:-
- The Ultimate Guide to SQL Indexing and Query Optimization
- SQL Interview Questions Asked In Walmart For Data Analyst Post | CTC – 18 LPA | Learn With Curious Club!!
- SQL Interview Questions for Deloitte Data Engineer Roles: Your Ultimate Prep Guide
- Data Analyst SQL Interview Questions | EY (Ernst & Young) | Shared By An Experienced Data Analyst
- 1164 Product Price at a Given Date
Hi, I am Vishal Jaiswal, I have about a decade of experience of working in MNCs like Genpact, Savista, Ingenious. Currently i am working in EXL as a senior quality analyst. Using my writing skills i want to share the experience i have gained and help as many as i can.