
Tableau for Beginners: Measures and Dimensions – A Comprehensive Tutorial
Welcome to the world of Tableau! This tutorial will guide you through the fundamental concepts of Measures and Dimensions, the building blocks of any Tableau visualization. Understanding these concepts is crucial for effectively analyzing and presenting your data.
What are Measures and Dimensions?
Imagine you have a spreadsheet with information about sales. In this spreadsheet:
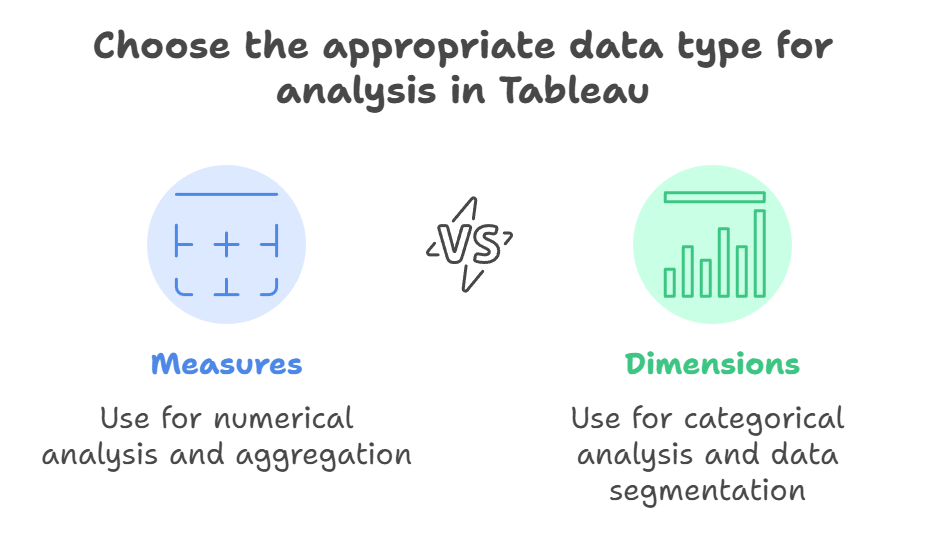
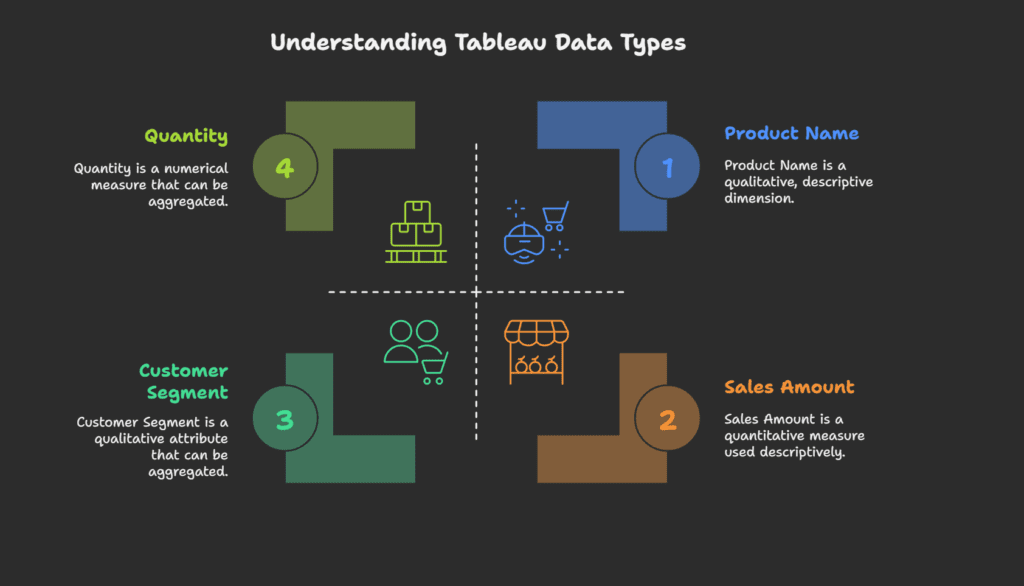
- Dimensions are descriptive attributes or categories. They are typically qualitative data that you use to slice and dice your data. Examples:
- Product Name
- Customer Segment
- Region
- Date
- Measures are numerical values that you can aggregate or calculate. They are typically quantitative data that you analyze. Examples:
- Sales Amount
- Quantity
- Profit
- Number of Customers
In simpler terms:
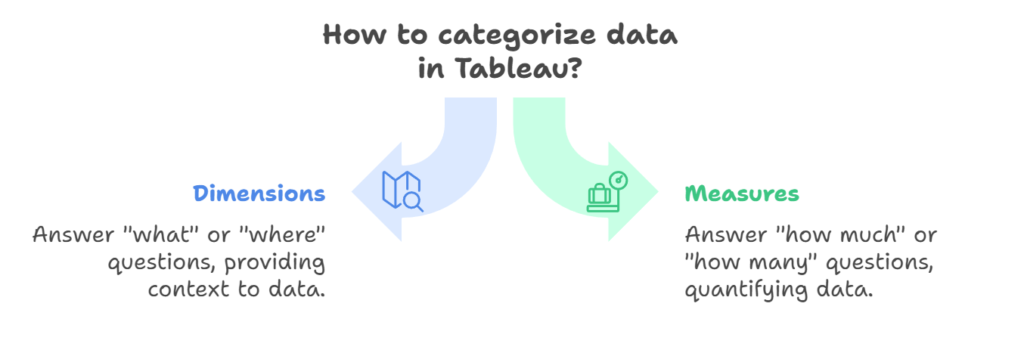
- Dimensions answer “what” or “where.”
- Measures answer “how much” or “how many.”
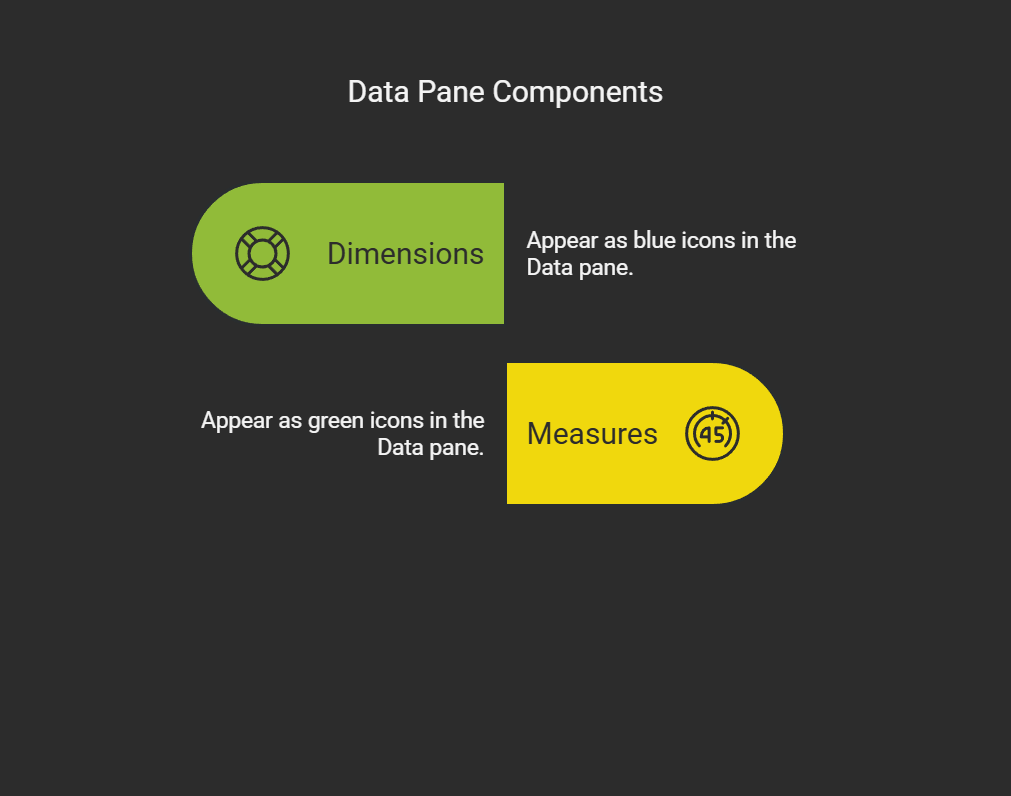
How Tableau Distinguishes Measures and Dimensions:
When you connect to a data source in Tableau, it automatically categorizes your fields as either Measures or Dimensions.
- Dimensions: Appear in the Data pane as blue icons.
- Measures: Appear in the Data pane as green icons.
Tableau’s intelligent engine tries to guess the correct type based on the data. However, you can always change the data type and role if needed.
We hope this article about Dimensions and Measures in Tableau was helpful for you and you learned a lot of new things from it. If you have friends or family members who would find it helpful, please share it to them or on social media.
Join our social media for more.
Also Read:
- Mastering Pivot Table in Python: A Comprehensive Guide
- Data Science Interview Questions Section 3: SQL, Data Warehousing, and General Analytics Concepts
- Data Science Interview Questions Section 2: 25 Questions Designed To Deepen Your Understanding
- Data Science Questions Section 1: Data Visualization & BI Tools (Power BI, Tableau, etc.)
- Optum Interview Questions: 30 Multiple Choice Questions (MCQs) with Answers
Hi, I am Vishal Jaiswal, I have about a decade of experience of working in MNCs like Genpact, Savista, Ingenious. Currently i am working in EXL as a senior quality analyst. Using my writing skills i want to share the experience i have gained and help as many as i can.