
Understanding the SQL LAG Function (With Examples)
SQL LAG function is a powerful tool that enables you to access data from the previous row, which is related to the current row as well. It’s incredibly useful for trend analysis.
For example, if you are tracking how much a stock price has changed from the previous year to the current one, the SQL LAG function becomes invaluable here. It helps you pull in the data you need from the past to make these comparisons easily.
Syntax and Parameters
LAG(column_name, offset, default_value) OVER (PARTITION BY column_name ORDER BY column_name)column_name: Column to retrieve the previous value from.offset: Number of rows to look back (default is 1).default_value: Value to return if there is no previous row (this is optional).OVER clause: Defines how the rows are partitioned (this is optional) and ordered.
Example Use Case
Let us take an example to understand this better. We have a sales table, with columns region, year, and sales amount.
We will write a query that adds another column and show the sales from the previous year and compare it with the current year sales.
This way, you can easily see the change in sales from one year to the next.
Example 1
Select
    year,
    sales_amount,
    LAG(sales_amount,1) over(ORDER BY year) as prev_year_sales
From sales_data;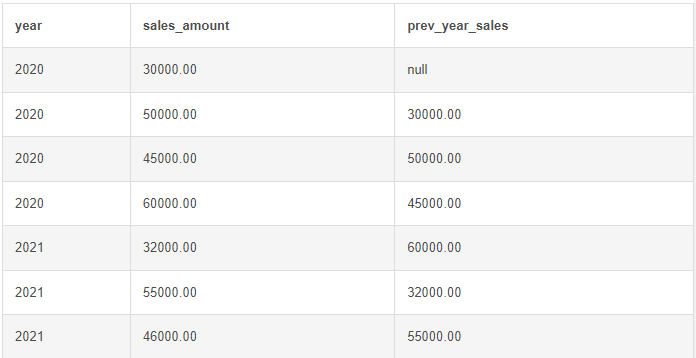
We start by selecting the year and sales amount. Then, we use LAG to select the previous year’s sales alongside the current year’s data. Now, the key part is how we define the components of LAG.
LAG(sales_amount, 1) means the function looks back one row to fetch the data from the previous year. To make sure it works accurately, we need to order the table by the year column. This ensures that the rows are properly sorted before fetching the previous year’s data.
Example 2
Select
	region,
	year,
	sales_amount,
	LAG(sales_amount,1) over(PARTITION BY region ORDER BY year) as prev_year_sales
From sales_data;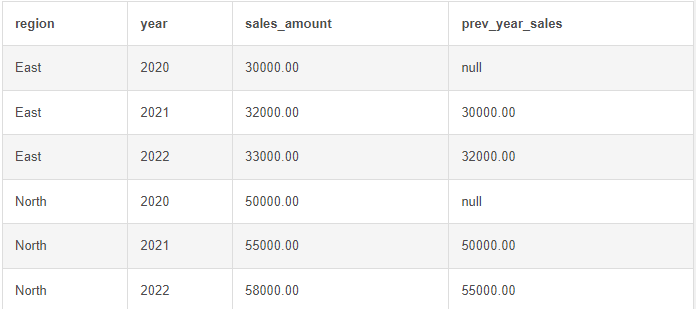
In this example, we have added the region column to showcase how PARTITION BY can be used. You can see that, by using the PARTITION B region, we get a differentiation by each region.
This means that when we calculate the previous year’s sales, it’s done separately for each region, ensuring that comparisons are made within the same region rather than across all regions.
Example 3
SELECT
    region,
    year,
    sales_amount,
    LAG(sales_amount) OVER (PARTITION BY region ORDER BY year) AS previous_year_sales,
    sales_amount - LAG(sales_amount) OVER (PARTITION BY region ORDER BY year) AS sales_change,
    CASE
        WHEN sales_amount > LAG(sales_amount) OVER (PARTITION BY region ORDER BY year) THEN 'Growth'
        WHEN sales_amount < LAG(sales_amount) OVER (PARTITION BY region ORDER BY year) THEN 'Decline'
        ELSE 'No Change'
    END AS growth_trend
FROM sales_data;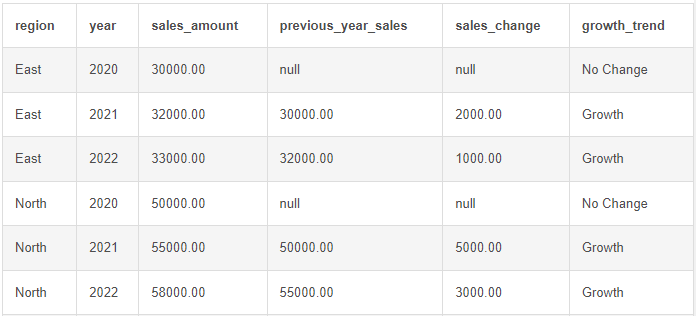
This example shows how a completed report should look, with an additional column indicating the growth trend, whether it’s positive or negative.
With this, you can easily spot if the sales have increased or decreased compared to the previous year.
LAG vs. LEAD
LAG retrieves past data, LEAD retrieves future values, making them complementary for analyzing trends both backward and forward.
Best Practices
- Always use the
ORDER BYclause for meaningful results. - Use
PARTITION BYfor grouped comparisons. - Consider performance when working with large datasets—ensure indexes on
ORDER BYcolumns.
For better performance make sure your ORDER BY column is indexed, especially when querying a large table.
Common Mistakes
- Forgetting
ORDER BY, leading to meaningless results. - Misinterpreting the
offsetparameter. - Assuming
default_valueis required (it’s optional)
I hope this article would have helped you understand the SQL LAG Function better, consider sharing this with your friends. thank you.
Read more
- Mastering Pivot Table in Python: A Comprehensive Guide
- Data Science Interview Questions Section 3: SQL, Data Warehousing, and General Analytics Concepts
- Data Science Interview Questions Section 2: 25 Questions Designed To Deepen Your Understanding
- Data Science Questions Section 1: Data Visualization & BI Tools (Power BI, Tableau, etc.)
- Optum Interview Questions: 30 Multiple Choice Questions (MCQs) with Answers
Hi, I am Vishal Jaiswal, I have about a decade of experience of working in MNCs like Genpact, Savista, Ingenious. Currently i am working in EXL as a senior quality analyst. Using my writing skills i want to share the experience i have gained and help as many as i can.