

Skewness
We always check for Skewness and Kurtosis while doing Exploratory Data Analysis, they both measure and give information about the shape of the data, but they capture different aspects of the data. Skewness measures and describe the asymmetry of distribution while Kurtosis measures the degree of peakedness or flatness.
Skewness is a statistical measure that describes the asymmetry of a probability distribution and quantifies the extent to which the data is shifted to one side (left or right) compared to a symmetrical, normal distribution (bell curve).
Understanding Skewness:
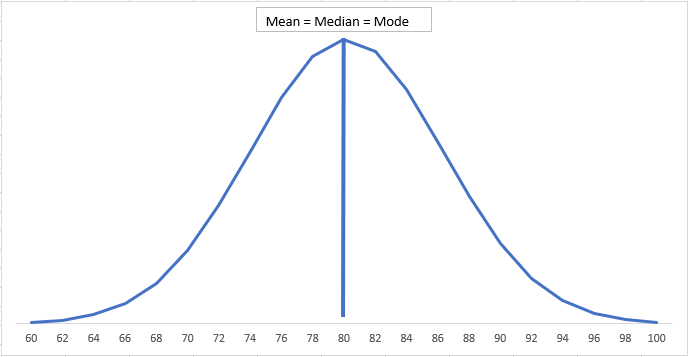
- A normal distribution is perfectly symmetrical, with an equal chance of data points falling on either side of the mean, when plotted to graph it looks like a hill with a well-defined peak. The peak of the curve is at the mean and the mean, median and mode are eighter equal or lie close to each other.
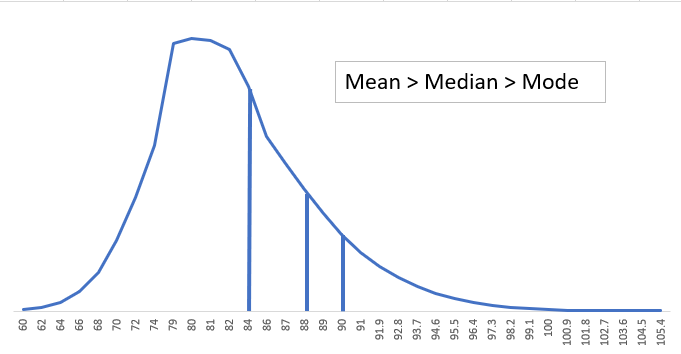
- A positively skewed distribution has a longer tail on the right side, this means there are more data points towards the higher end of the range compared to the lower end. In this mean will be greatest followed by median and then mode.
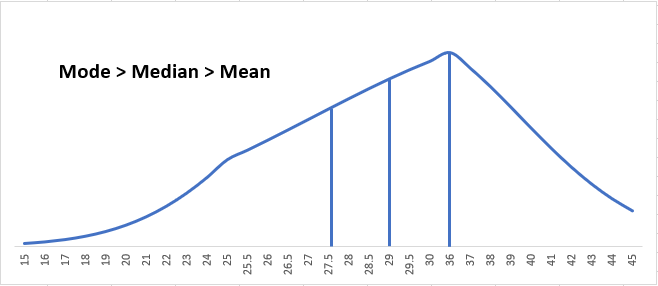
- A negatively skewed distribution has a longer tail on the left side, this means there are more data points towards the lower end of the range compared to the higher end. In this mode will be the greatest, median will be lesser than mode and mean will be the least.
Why is Skewness Important?
- Statistical tests like correlation analysis and linear regression, assume normality of data. Understanding skewness helps you assess if your data deviates significantly from normality and if alternative approaches are needed. Understanding skewness helps in data analysis by identifying asymmetry in data distribution, guiding the choice of appropriate statistical tests, informing data transformation needs, and improving model accuracy and reliability.
Calculating Skewness:
There are different formulas for calculating skewness, but a common one is based on the third moment of the data:
- Skewness = (Σ(xᵢ – x̄)³ ) / n * σ³
- xᵢ: Individual data point
- x̄: Mean of the data
- n: Total number of data points
- σ: Standard deviation of the data
Interpreting Skewness:
- A skewness value of 0 indicates a symmetrical distribution.
- A positive value (greater than 0) indicates a positive skew.
- A negative value (less than 0) indicates a negative skew.
The severity of skewness can be judged based on the magnitude of the value, but there’s no strict threshold. It depends on the context and the specific statistical test you plan to use.
Dealing with Skewness:
- Transformations: Sometimes, log or square root transformations can help normalize skewed data.
- Non-parametric tests: If normality is a major concern, consider non-parametric tests that don’t rely on this assumption.
- Robust methods: Statistical software might offer robust versions of tests that are less sensitive to skewness.
Kurtosis
Kurtosis is a statistical measure that describes the “tailedness” of a probability distribution. It tells you how much a distribution’s tails (the ends) differ from a normal distribution (bell curve).
Here’s a breakdown of kurtosis:
Understanding Kurtosis:
- A normal distribution has a moderate amount of weight in the tails, with most data points concentrated around the center (mean).
- A distribution with high kurtosis (leptokurtic) has heavier tails than a normal distribution. This means there are more data points in the extreme ends compared to the center. Imagine a distribution with sharper peaks and fatter tails.
- A distribution with low kurtosis (platykurtic) has lighter tails than a normal distribution. This means there are fewer data points in the tails compared to the center. Imagine a distribution with a flatter peak and thinner tails.
Why is Kurtosis Important?
- Kurtosis helps identify outliers in your data. High kurtosis can indicate a higher likelihood of extreme values.
- Understanding kurtosis can be crucial for selecting appropriate statistical tests. Some tests are more sensitive to outliers than others.
There’s no single formula for interpreting kurtosis values because the interpretation depends on the specific context and the number of data points. However:
- A kurtosis value of 3 indicates a normal distribution.
- A value greater than 3 suggests a leptokurtic distribution (heavy tails).
- A value less than 3 suggests a platykurtic distribution (lighter tails).
Visualizing Kurtosis:
While there’s no single plot for kurtosis, visualizing your data with a histogram and a density plot can help you assess the tail behavior and suspect high or low kurtosis.
Dealing with Kurtosis:
- Transformations: Sometimes, data transformations like log transformation can help reduce the influence of extreme values and make the distribution more normal.
- Robust methods: Statistical software might offer robust versions of tests that are less sensitive to outliers associated with high kurtosis.
We hope you found the information helpful! If you learned something valuable, consider sharing it with your friends, family, and social networks.
Related Articles:
- What are the types of hypothesis testing?
- Wilcoxon Signed-Rank Test Explained
- Mann-Whitney U Test Explained
- Chi-Square Test Explained
- Z-Test Explained
- T-Test Explained
Hi, I am Vishal Jaiswal, I have about a decade of experience of working in MNCs like Genpact, Savista, Ingenious. Currently i am working in EXL as a senior quality analyst. Using my writing skills i want to share the experience i have gained and help as many as i can.